Lesson 2-1: Logging and Inspect Tool
Inspect
For this part of the lesson, we will try to get comfortable with editing/testing your web pages from a web browser using the inspect tool. Google Chrome will be used in the tutorial, but any other popular browser should work roughly the same way.
Key Benefits
- Able to quickly modify webpage elements and experiment with temporary styles without having to modify the source code itself.
- Enables quick location of where specific webpage elements are in the HTML source code.
- Helpful when trying to find and fix problems on your webpage.
- Useful when designing for different screen sizes.
- Clearly displays the box model at work.
Tutorial
- Paste this code into your and open up the webpage in a new tab, so you are viewing it in full screen.
index.html
Your webpage should look like this.

- Now right click on any part of the webpage and select 'Inspect'.

Your screen should look something like this now.

- You can adjust the screen size of your webpage using this area. Right now it is set to 'Dimensions: Responsive', which allows you to use the vertical bar to adjust the size. The '678' area displays the width and '75%' allows you to choose how zoomed in or out you want to view your webpage.

You can also select a specific screen size by clicking on 'Dimensions: Responsive' and choosing a diferrent one.

The purpose of being able to the adjust the screen size is to enable a simple and intuitive way to test with various screen sizes, including fixed dimensions, and see how responsive your website is.
There are two general ways to adjust the screen size:
- Manually enter your screen width size (or height, if applicable)
- Drag the bars on the right and bottom of the webpage to test different screen sizes.
A key advantage of knowing how to use this is that you can quickly see how mobile- or desktop-friendly your website is!
- The full HTML source code of your current page will be shown on the right (or bottom, depending on your dock location). As you hover your mouse or click on certain elements of the HTML code, your actual webpage should begin to highlight that element you are selecting.

The different colors in the highlight represent the box model. If you scroll down in the styles section below, you will be able to see what each color represents. Every element uses the same color representation, but with the specfic element's dimensions. For example, it is showing us that the
h1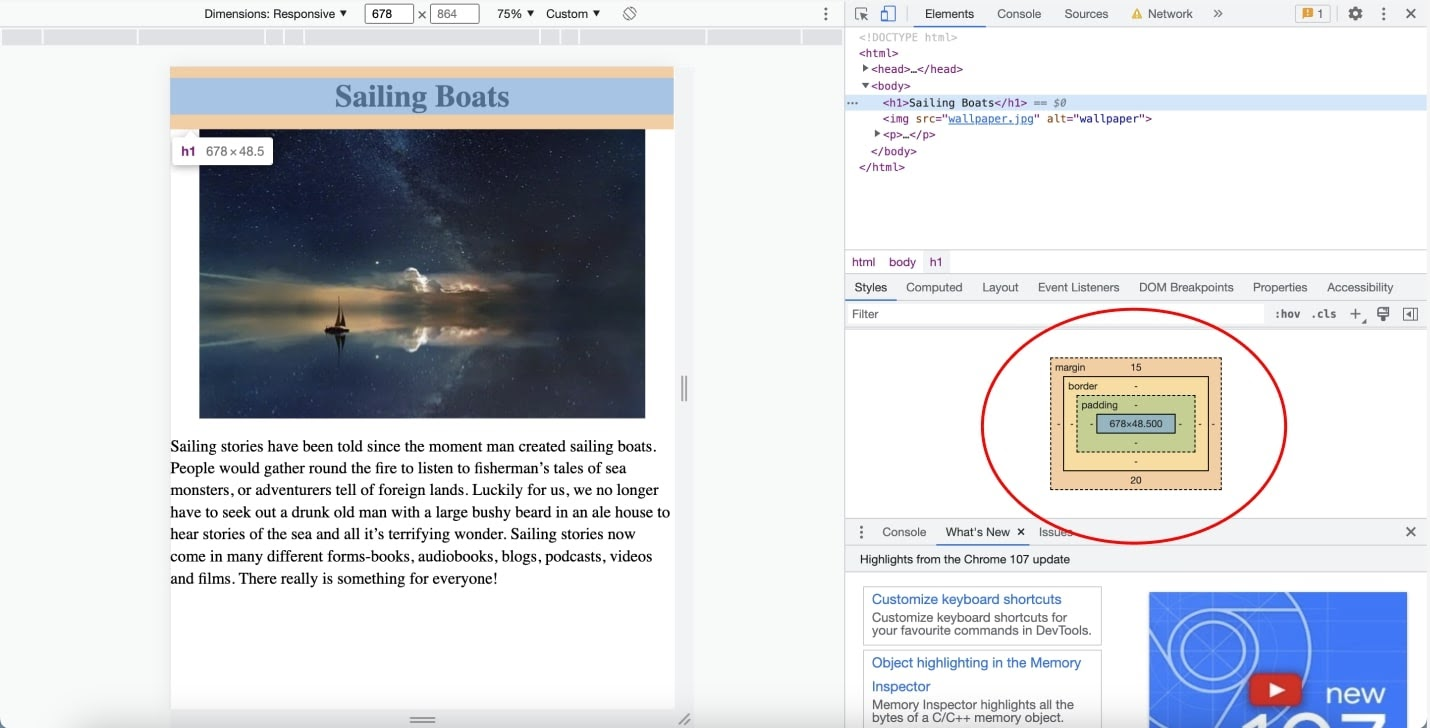
On your browser's dev tools, you can also delete any HTML element in the page (along with any of its children) by
- selecting/clicking on the source HTML code once.
- pressing 'delete'.
You can also modify any portion (element type, attribute, inner text content) of an HTML element in the page by
- clicking on the source HTML code twice.
- typing your replacement content.
- The CSS of your webpage will be shown on the bottom right, but some of the CSS is "hidden" CSS (in that you won't see it on your style.css file) and only the CSS relevant to the HTML element selected is shown.
The CSS code can be modified directly on the browser, but any changes will not be saved.
For example, if we wanted to change the color of the font for 'Sailing Boats', we will need to select the
h1index.html
When you hover over a section, there are checkboxes that will appear for each property. You can uncheck them and recheck them to see how it affects your page.

NOTE: If you manipulate your webpage's code on your browser, NONE of those manipulations will be saved! YOU WILL LOSE ALL WORK once you exit or refresh the tab! Only use this area to test small changes you are considering, and then once you know what you want implement or copy and paste those changes in replit or VSCode where they will be saved!
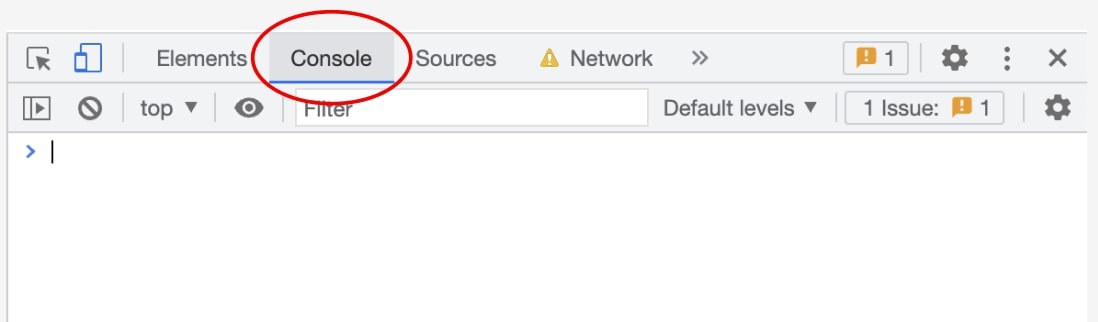
- There is also a console that we can use by clicking on the tab right next to
Console. This is where we will see JavaScript we print out like how there is a place for us to see code we print in other programming languages.Elements
Logging to the Console
Now that we've learned how to open up the console, we'll write some JavaScript code to understand how to log to the console.
There are two ways to add JavaScript to your HTML file:
- Add a tag before the closing
scripttag and write JavaScript code in between.body

- Add a tag before the closing
scripttag with abodyattribute that links to a js file, such assrc. Then, write JavaScript code in thescript.jsfile.script.js


console.log("hello world");console.logThere are also other console methods. Try out these lines of code:
The string in the parentheses WILL appear in the console. In Google Chrome and most modern browsers, the styling of each of the three should be distinct:

a. Console output should be used to make note of specific events or completion of specific processes that doesn't affect the integrity of the site and which the front-end user isn't expected to be aware of.
b. Warnings should communicate that actions have been taken or could be taken that could lead to unexpected results or affect the site's integrity, but not immediately so.
c. Errors indicate something unexpected or destructive has occurred.
When writing code in JavaScript, you will often see warnings and errors that you probably didn't write yourself. Those are helpful indicators from the browser that tell you there is something wrong with your code.
Lastly, try out alerts:
- Alerts will not manifest in the console itself, instead appearing as a popup:
